 MacHealthDownload
Your
Mac,
scored.
One number from 0 to 100 for how your Mac is doing, what is costing points, and a fix for each one. It lives in the menu bar.
Download for MacFree. For macOS 26 and later, Apple silicon and Intel.
Fix what it finds. Watch it climb.
These are the kinds of things MacHealth flags on a real Mac. Try the fixes.
54
5 things are holding this Mac back.
Chrome is using 9.8 GB of memory
Apps are competing for RAM and macOS has started swapping.
Xcode kept the CPU busy for 10 minutes
84% on average. Everything else is waiting for it.
Macintosh HD is 84% full
macOS needs free space for swap and updates.
3 dev servers idle since yesterday
They hold 1.4 GB and ports 3000, 4321 and 8000.
2 leftover startup items
They launch programs from apps you already deleted.
Everything, one click away.
Click the heart in the menu bar. Score, CPU, memory, disk, network, GPU, battery, temperature and power, the apps using the most, and your dev servers. Right-click an app to quit it.
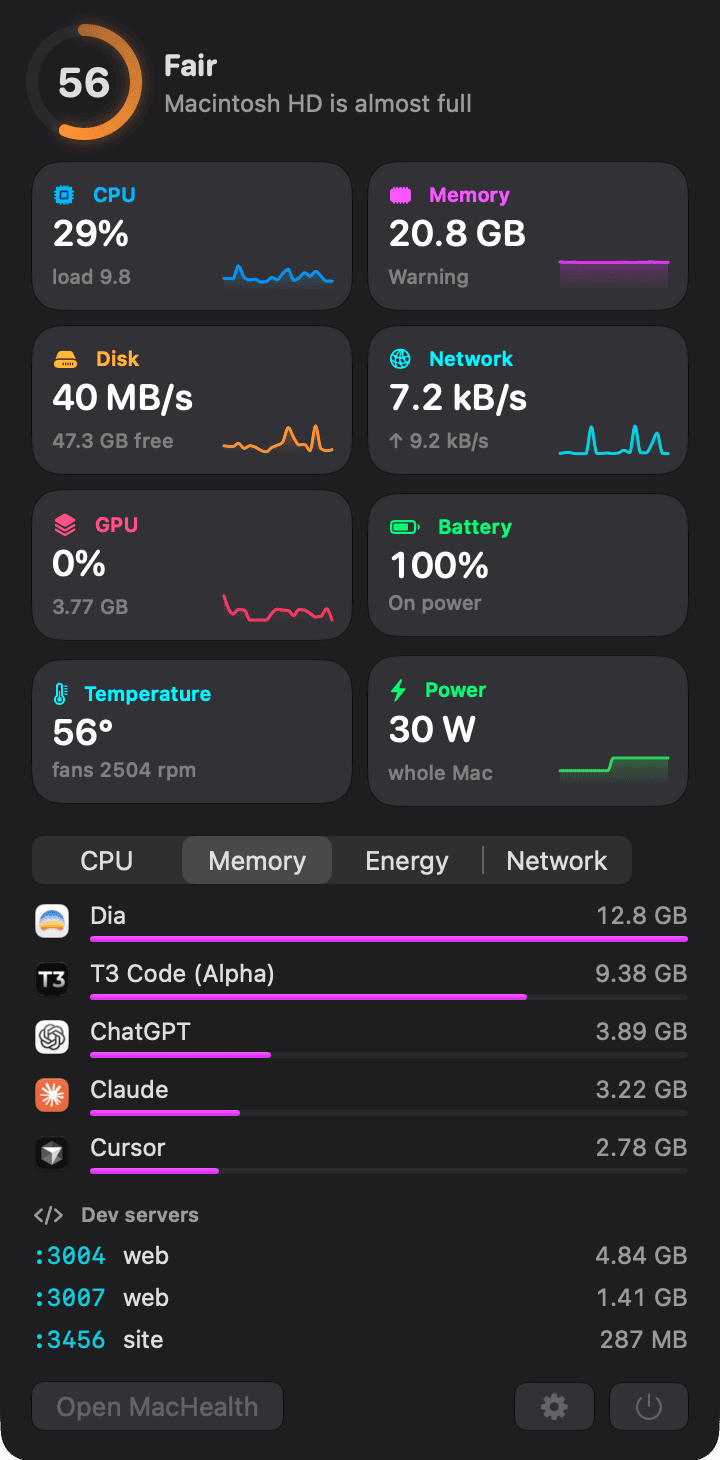
A closer look.
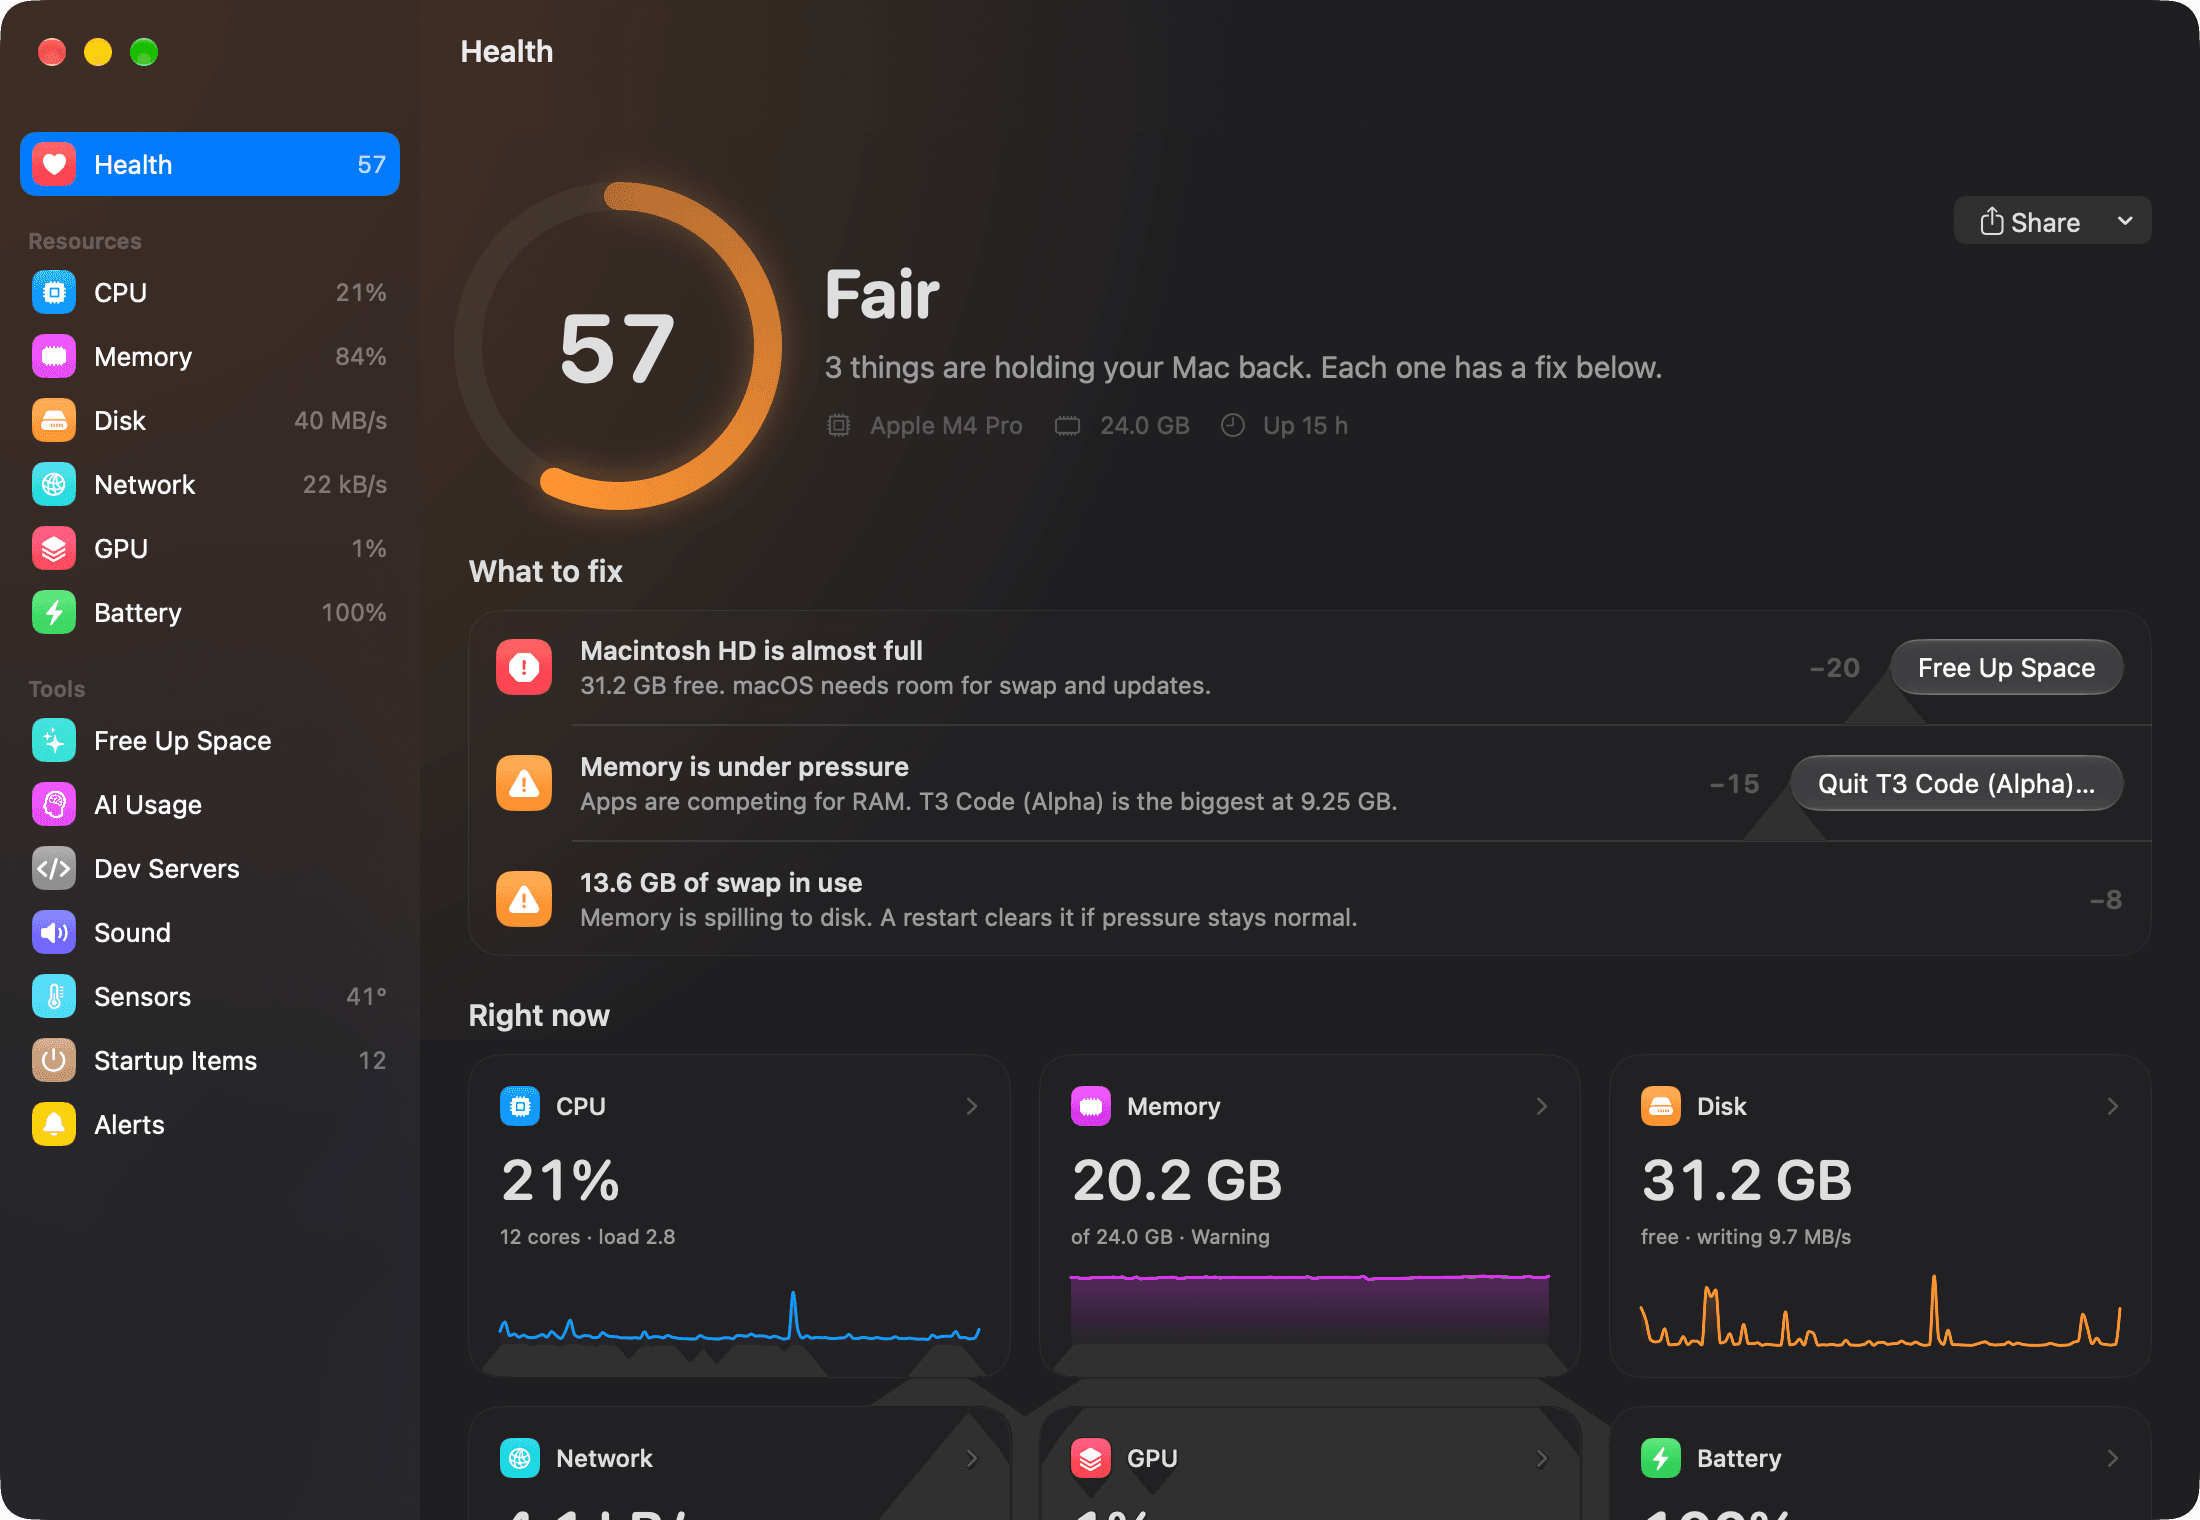
One score, and what to fix.
The Health page scores your Mac from 0 to 100 and lists every problem that costs points: memory pressure, swap, a full disk, idle dev servers, leftover startup items, a battery that needs service. Each one comes with its fix.
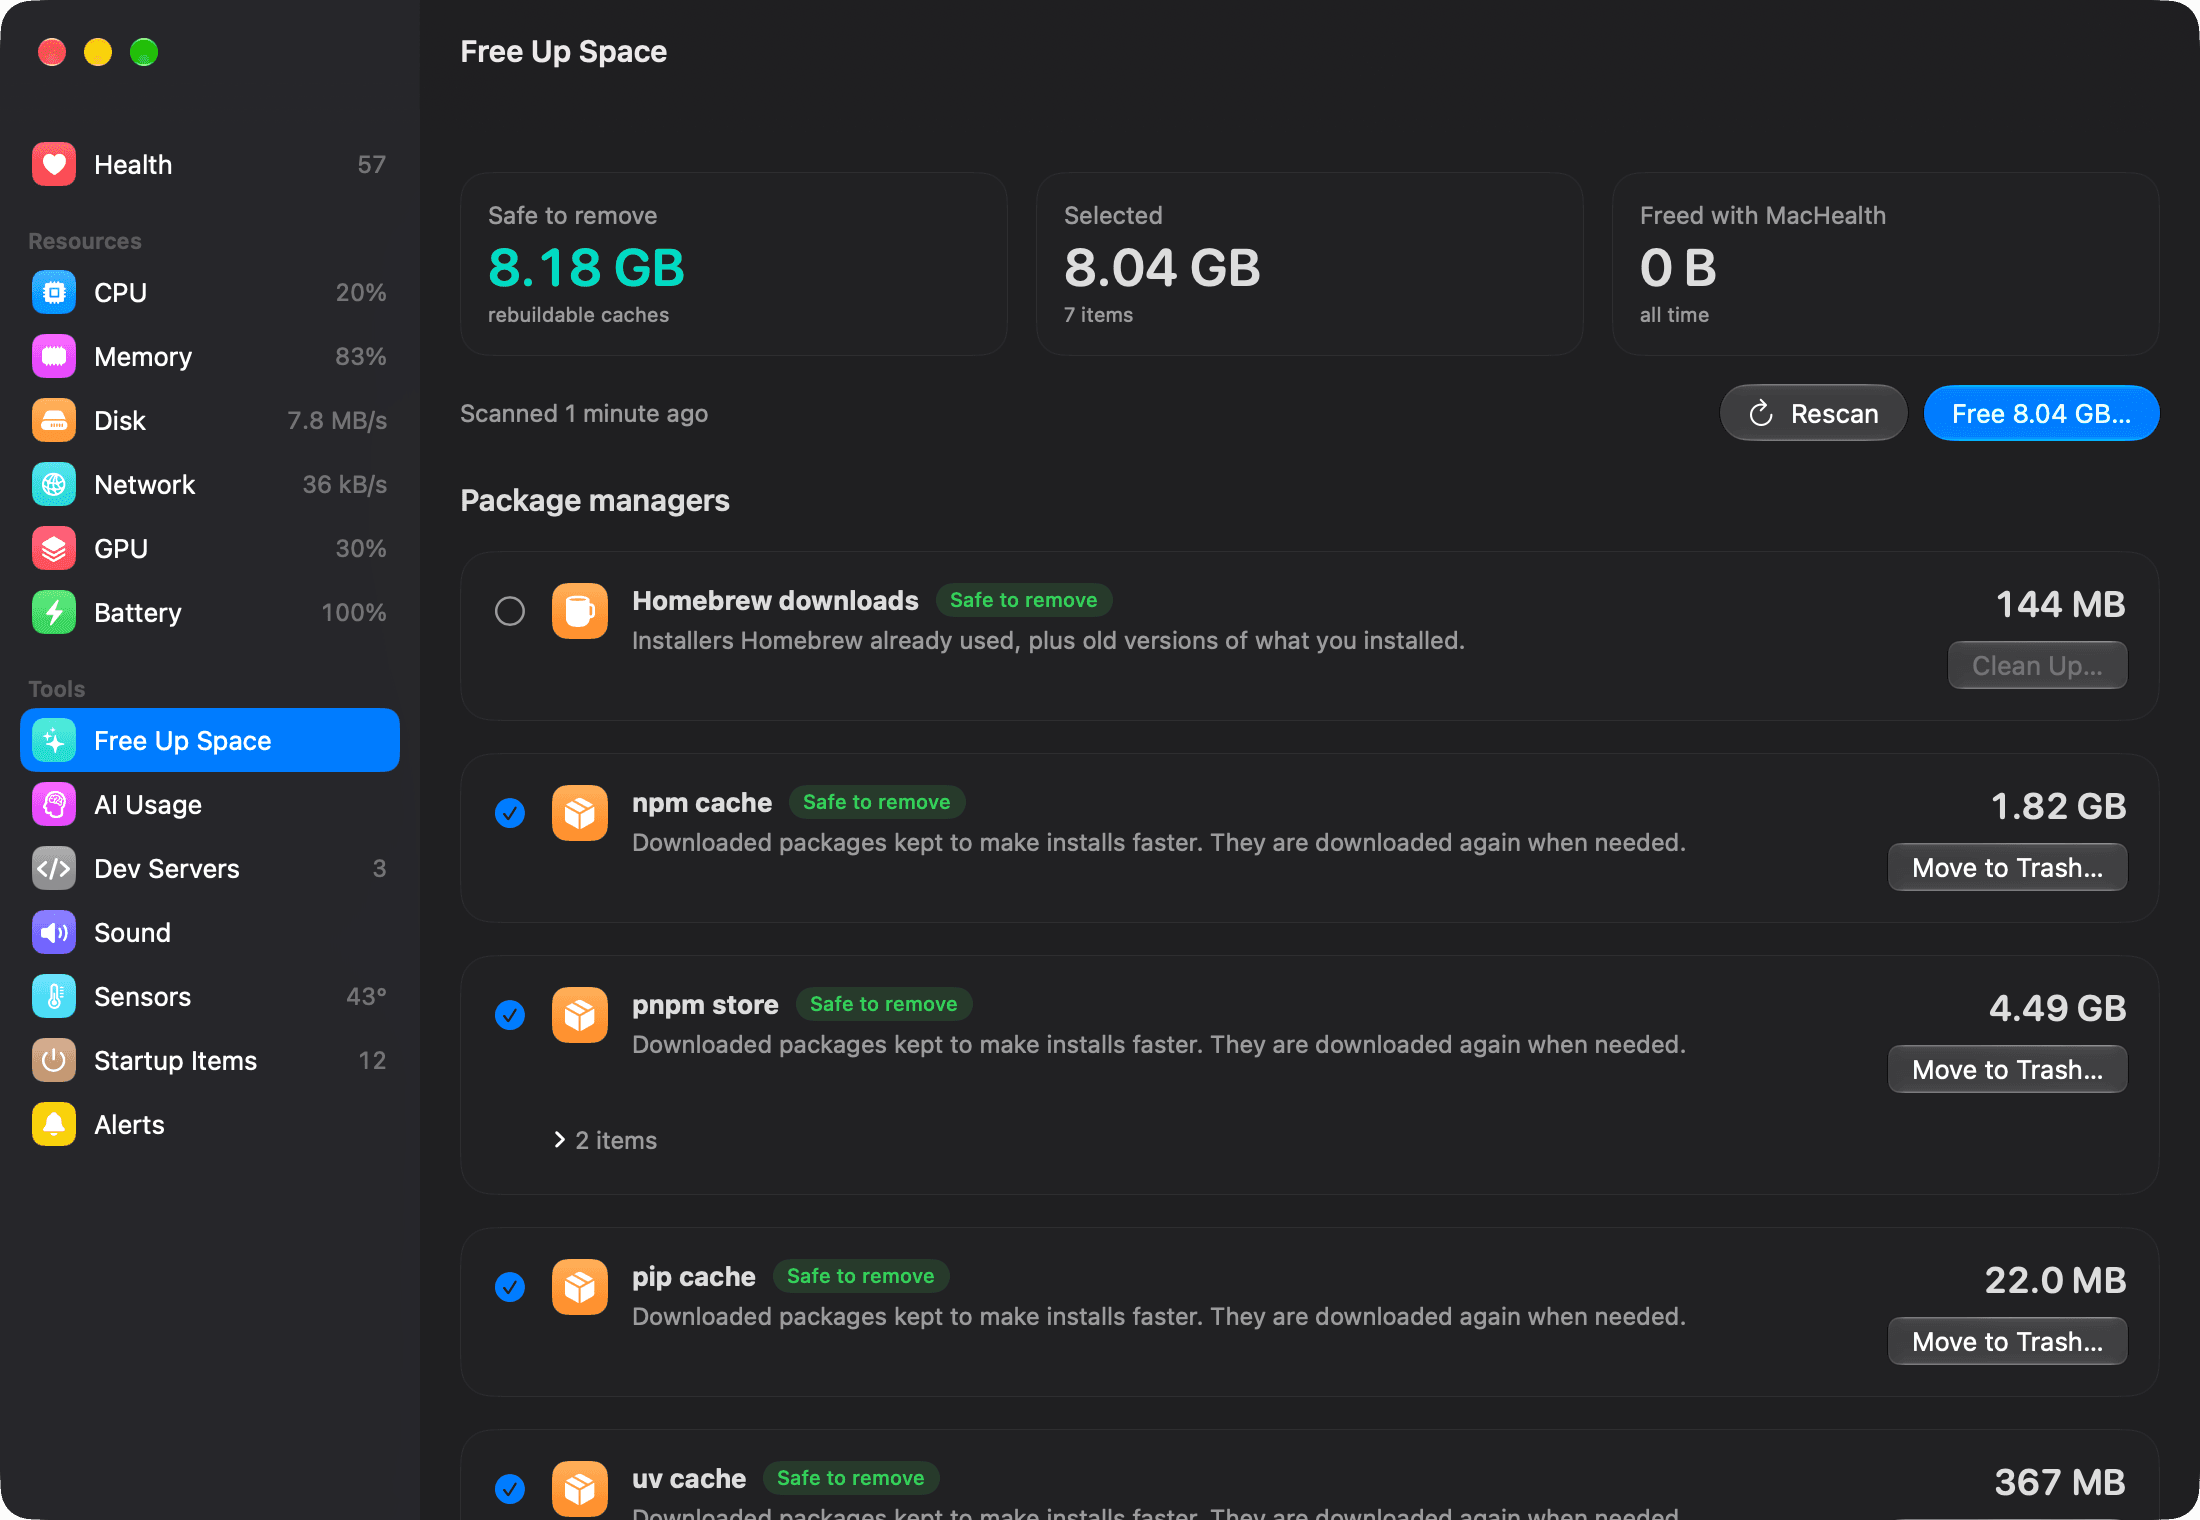
Space back, safely.
Finds what a developer's Mac fills up with: Xcode builds, old node_modules, package caches, Docker leftovers, big forgotten downloads. It says what each one is and whether it is safe, and moves it to the Trash so you can change your mind.
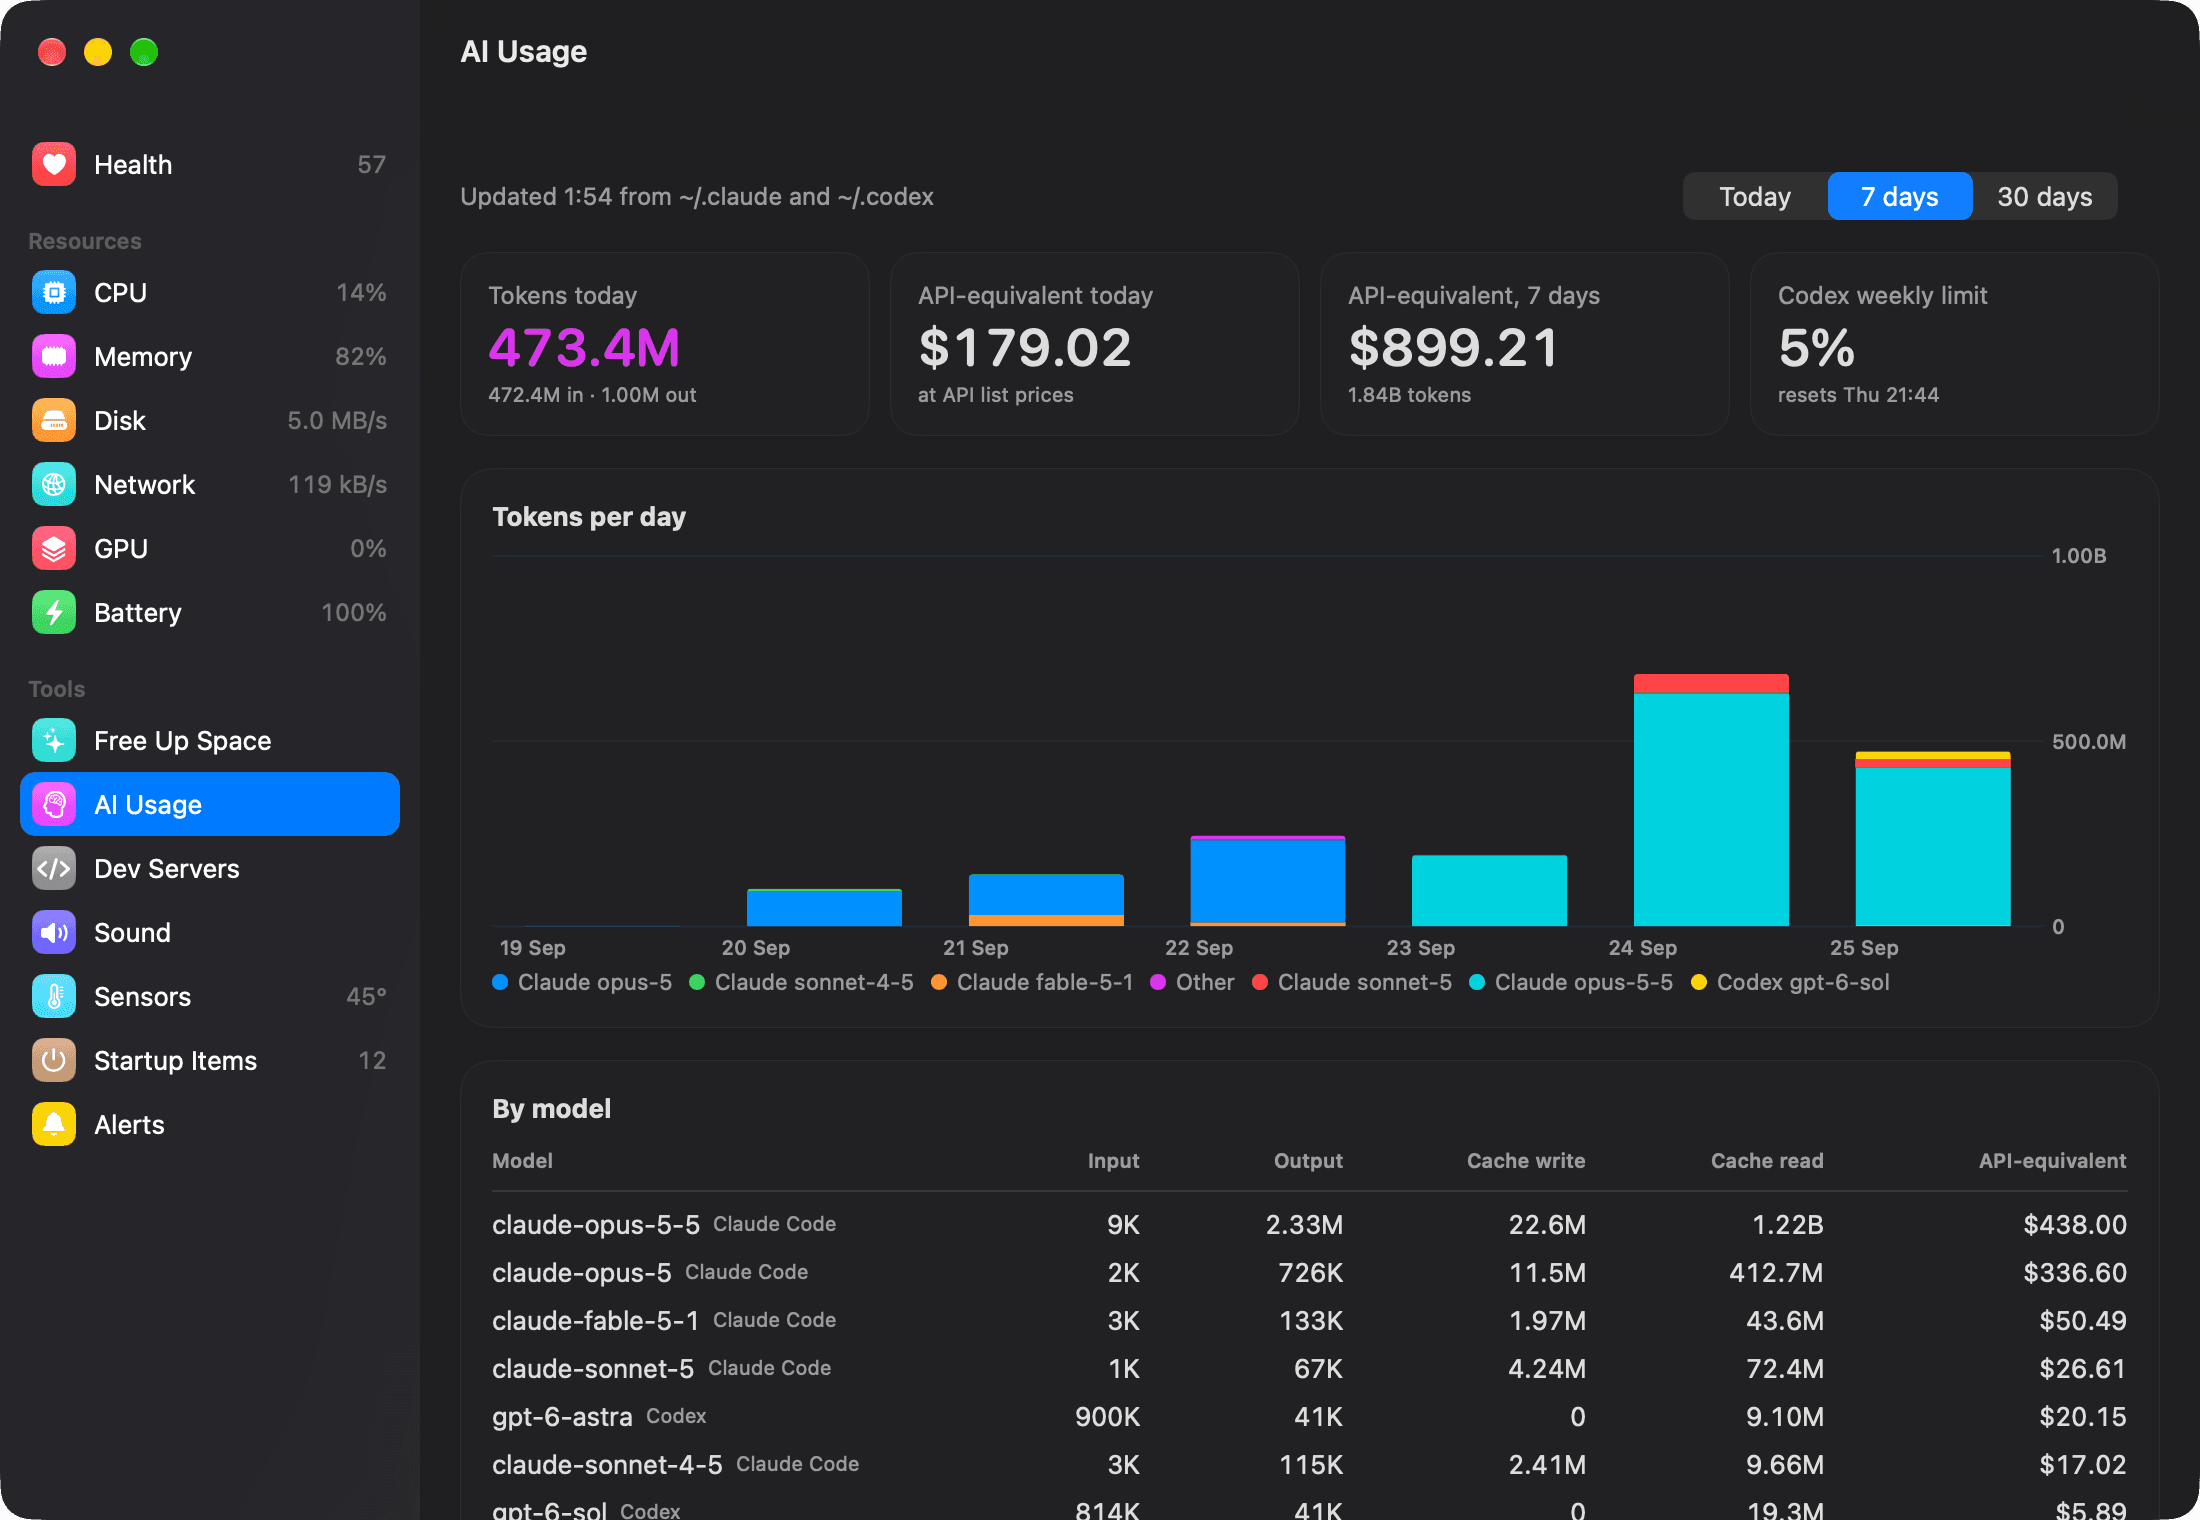
What your AI tools use.
Tokens per day and per model from Claude Code and Codex, what they would cost at API prices, your top projects, and how close you are to your Codex plan limit. Read from local logs only.
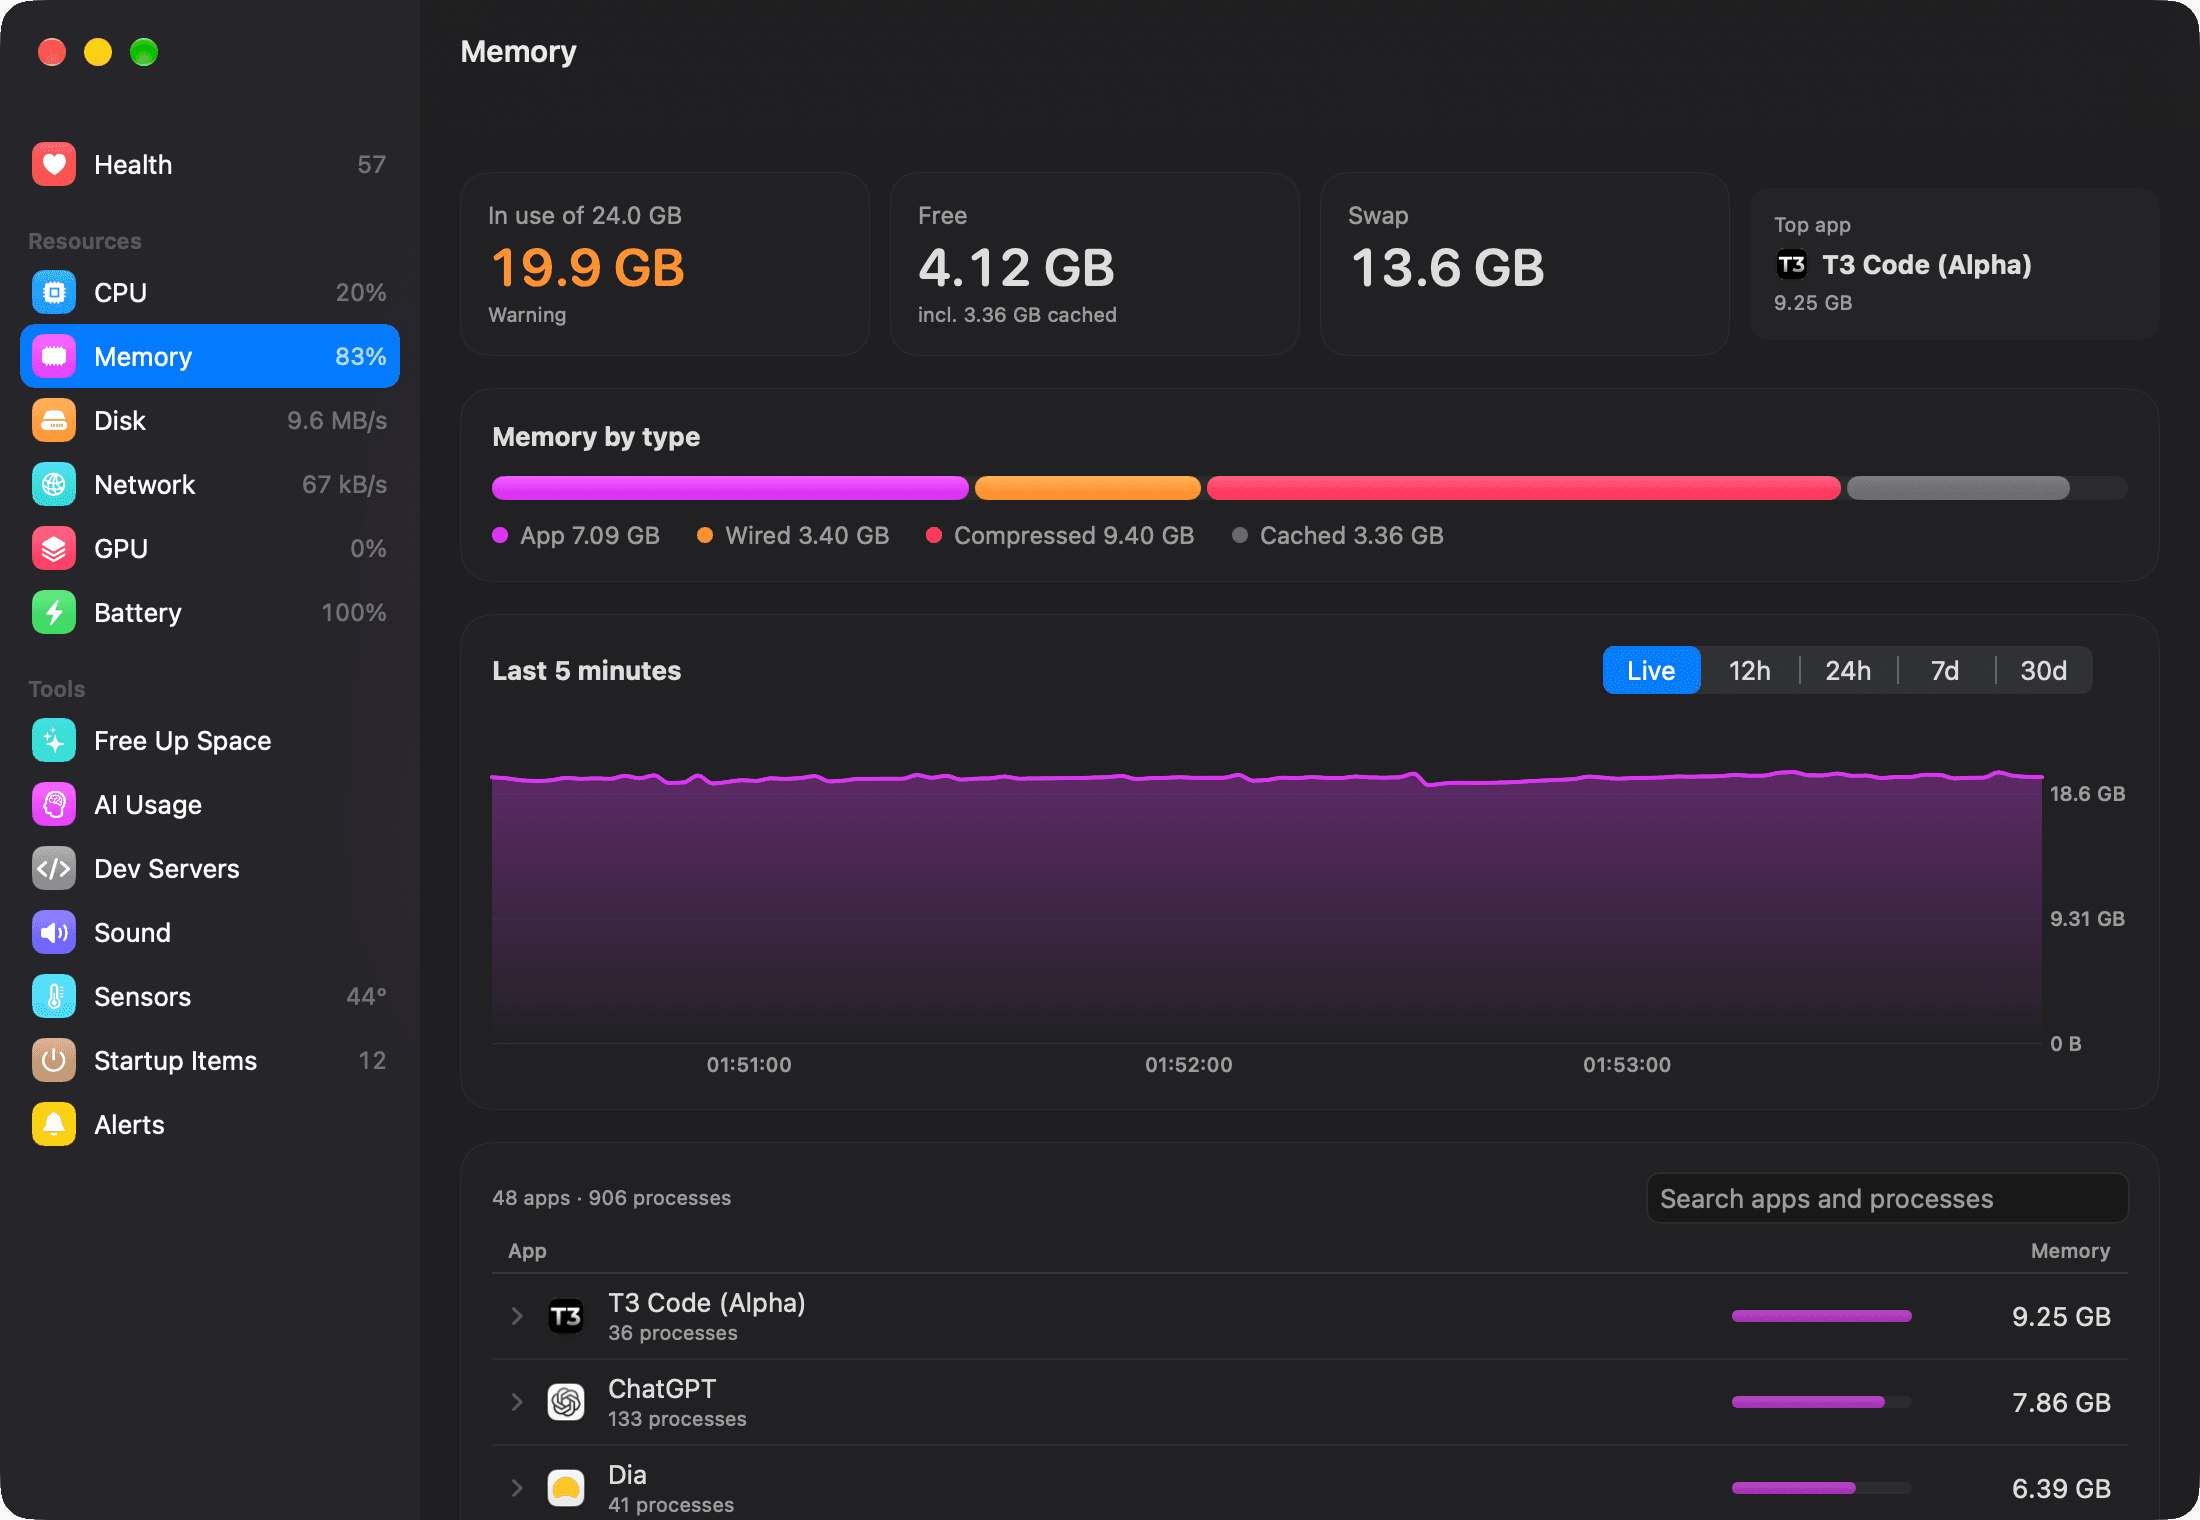
Memory, by app.
See how much memory each app really uses, with all its helper processes added in, and how your RAM splits into app memory, wired, compressed and cache. Swap and memory pressure are right at the top.
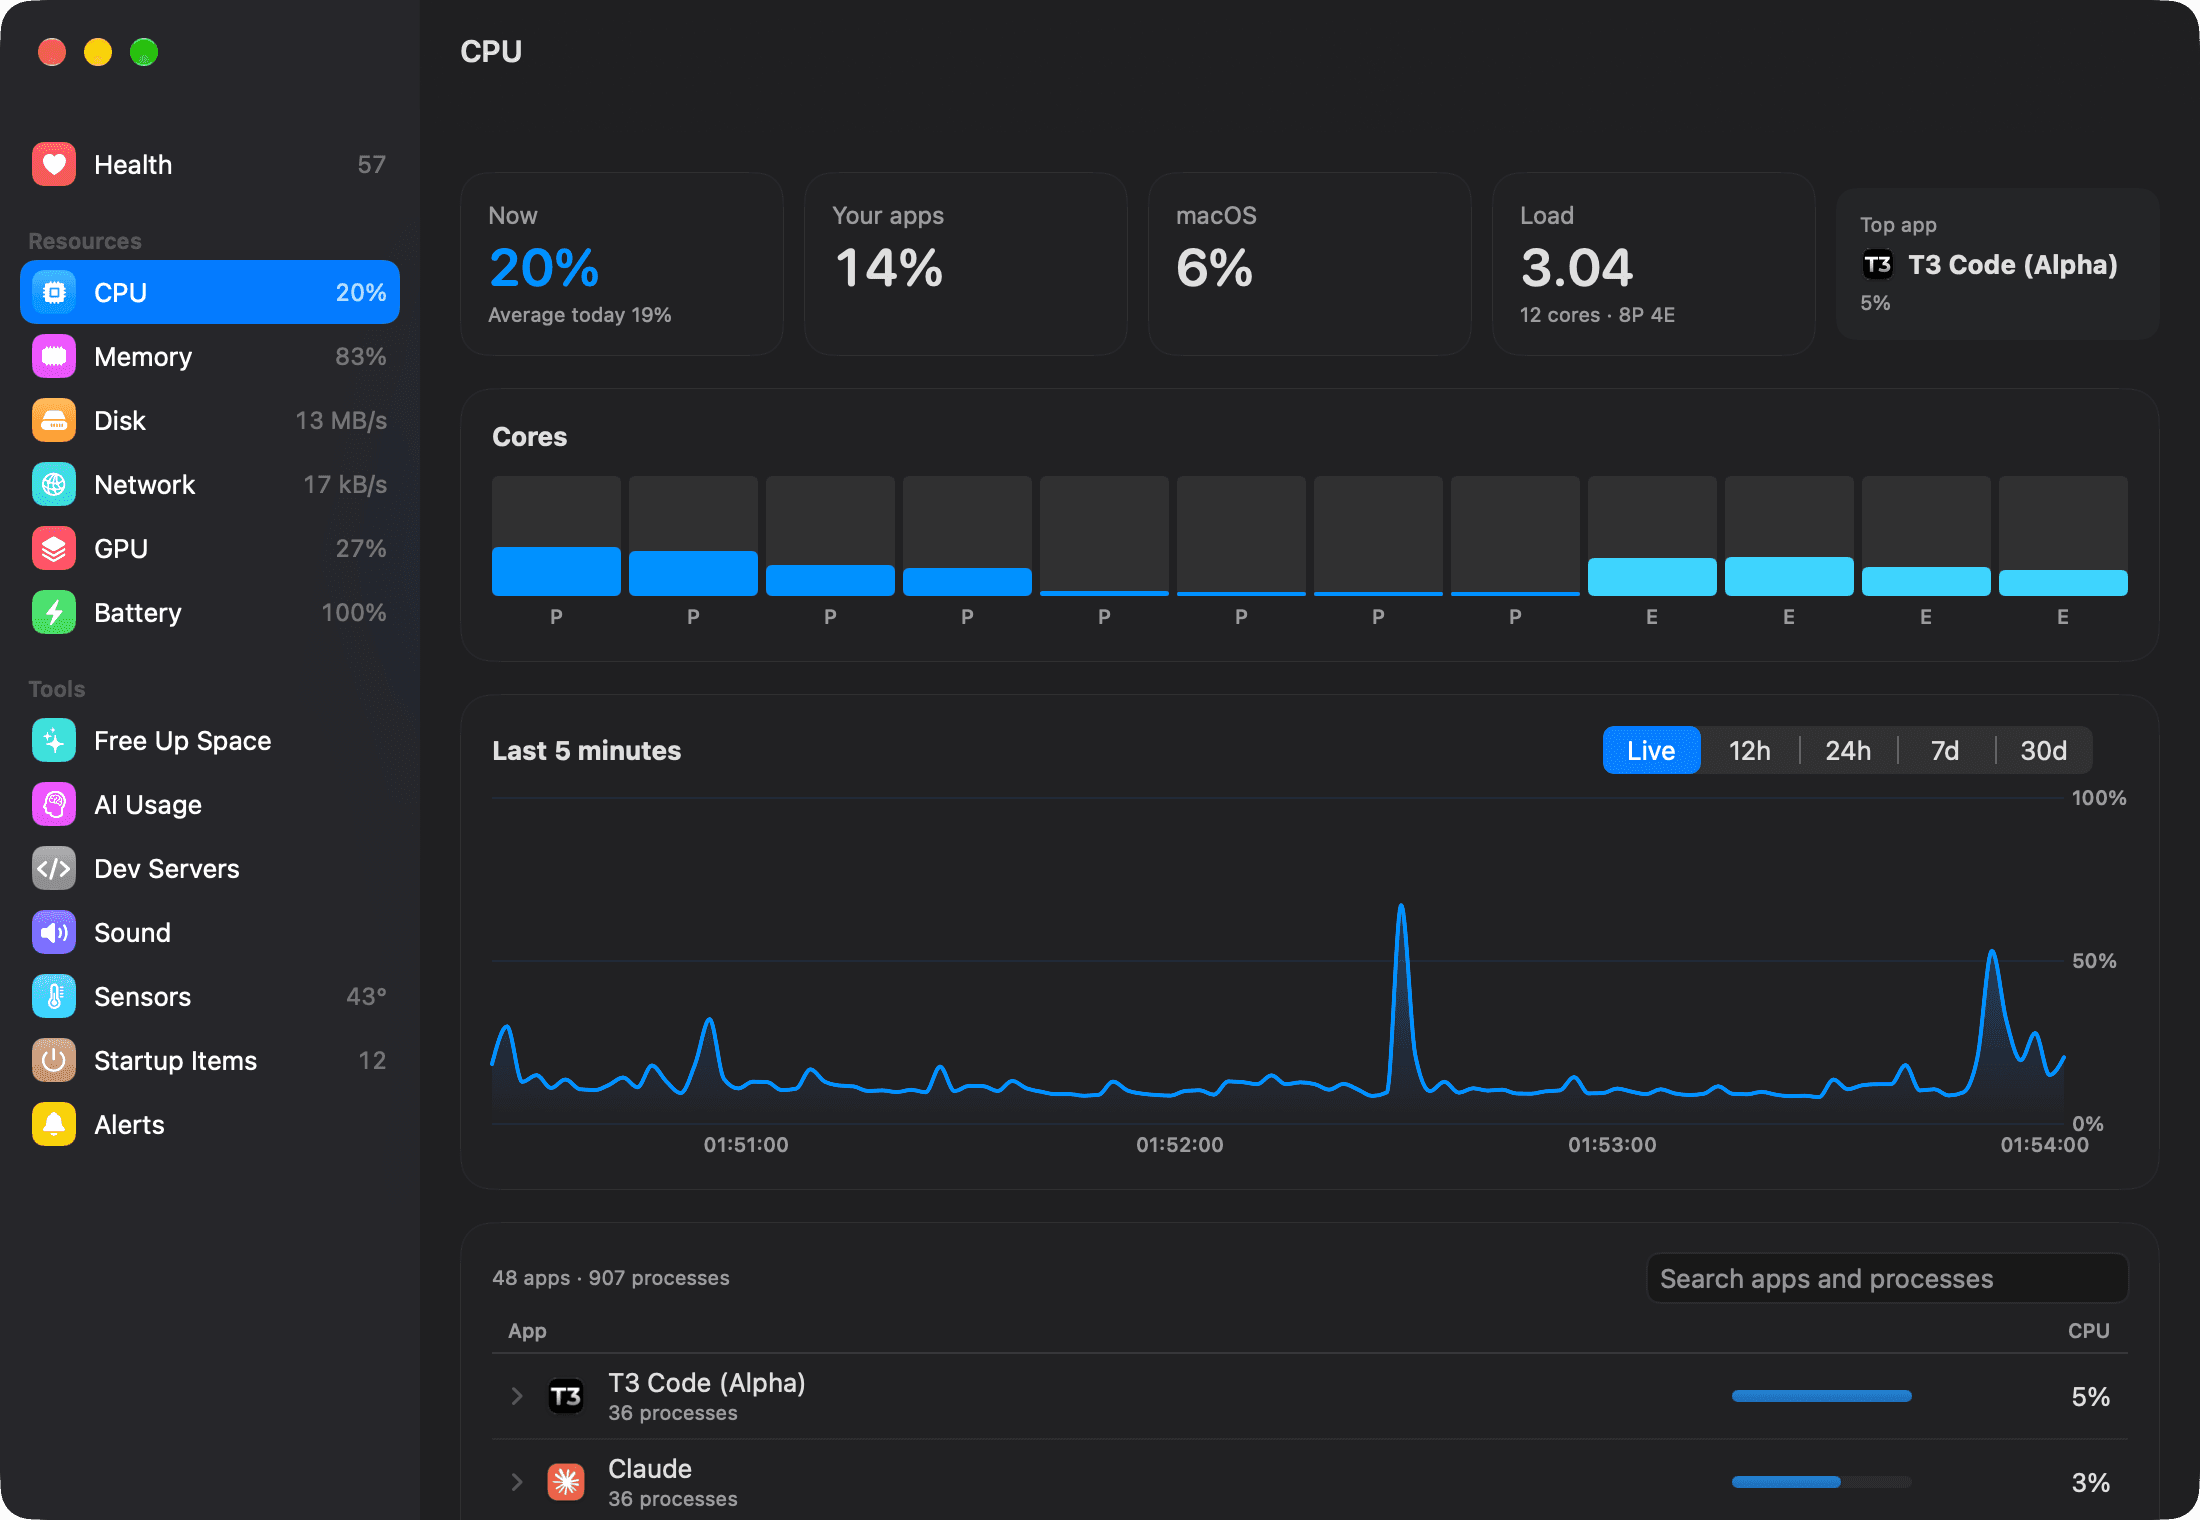
Every core, every app.
Live load on each performance and efficiency core, and which app is keeping the CPU busy. Switch the chart to 12 hours, 24 hours, 7 or 30 days to see what happened while you were away.
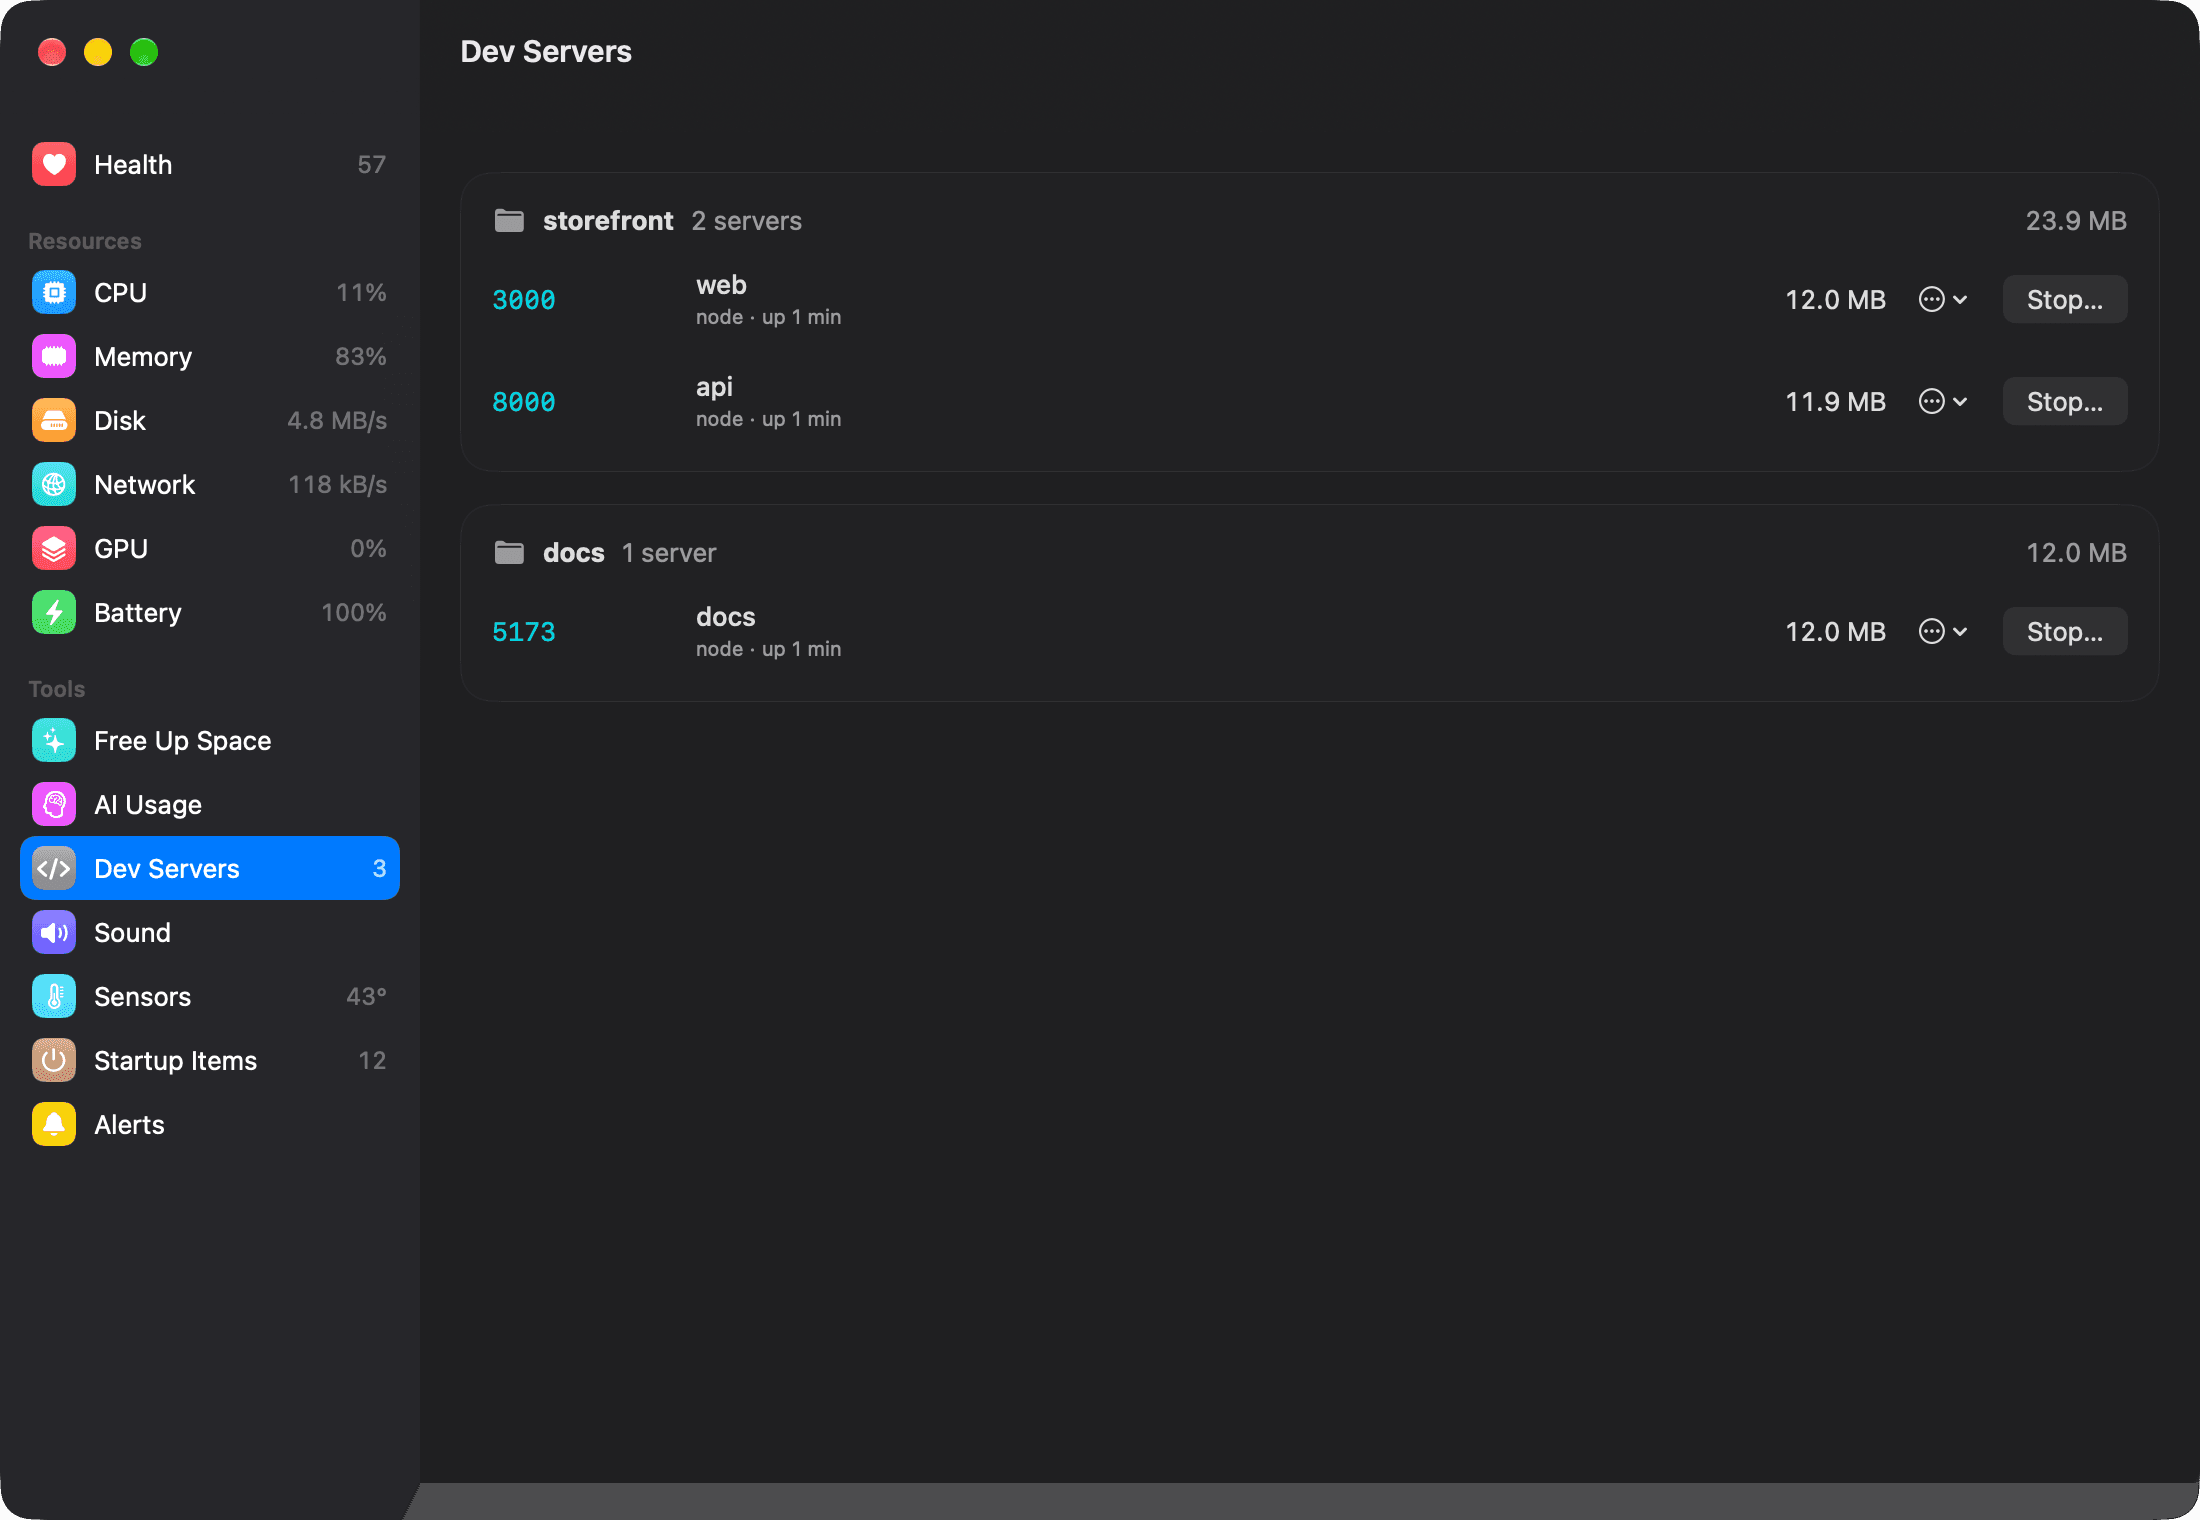
Your ports, by project.
Every server listening on a port, grouped by the repo it runs in, with its memory and how long it has been idle. Open it in the browser or stop it. MacHealth always asks first.
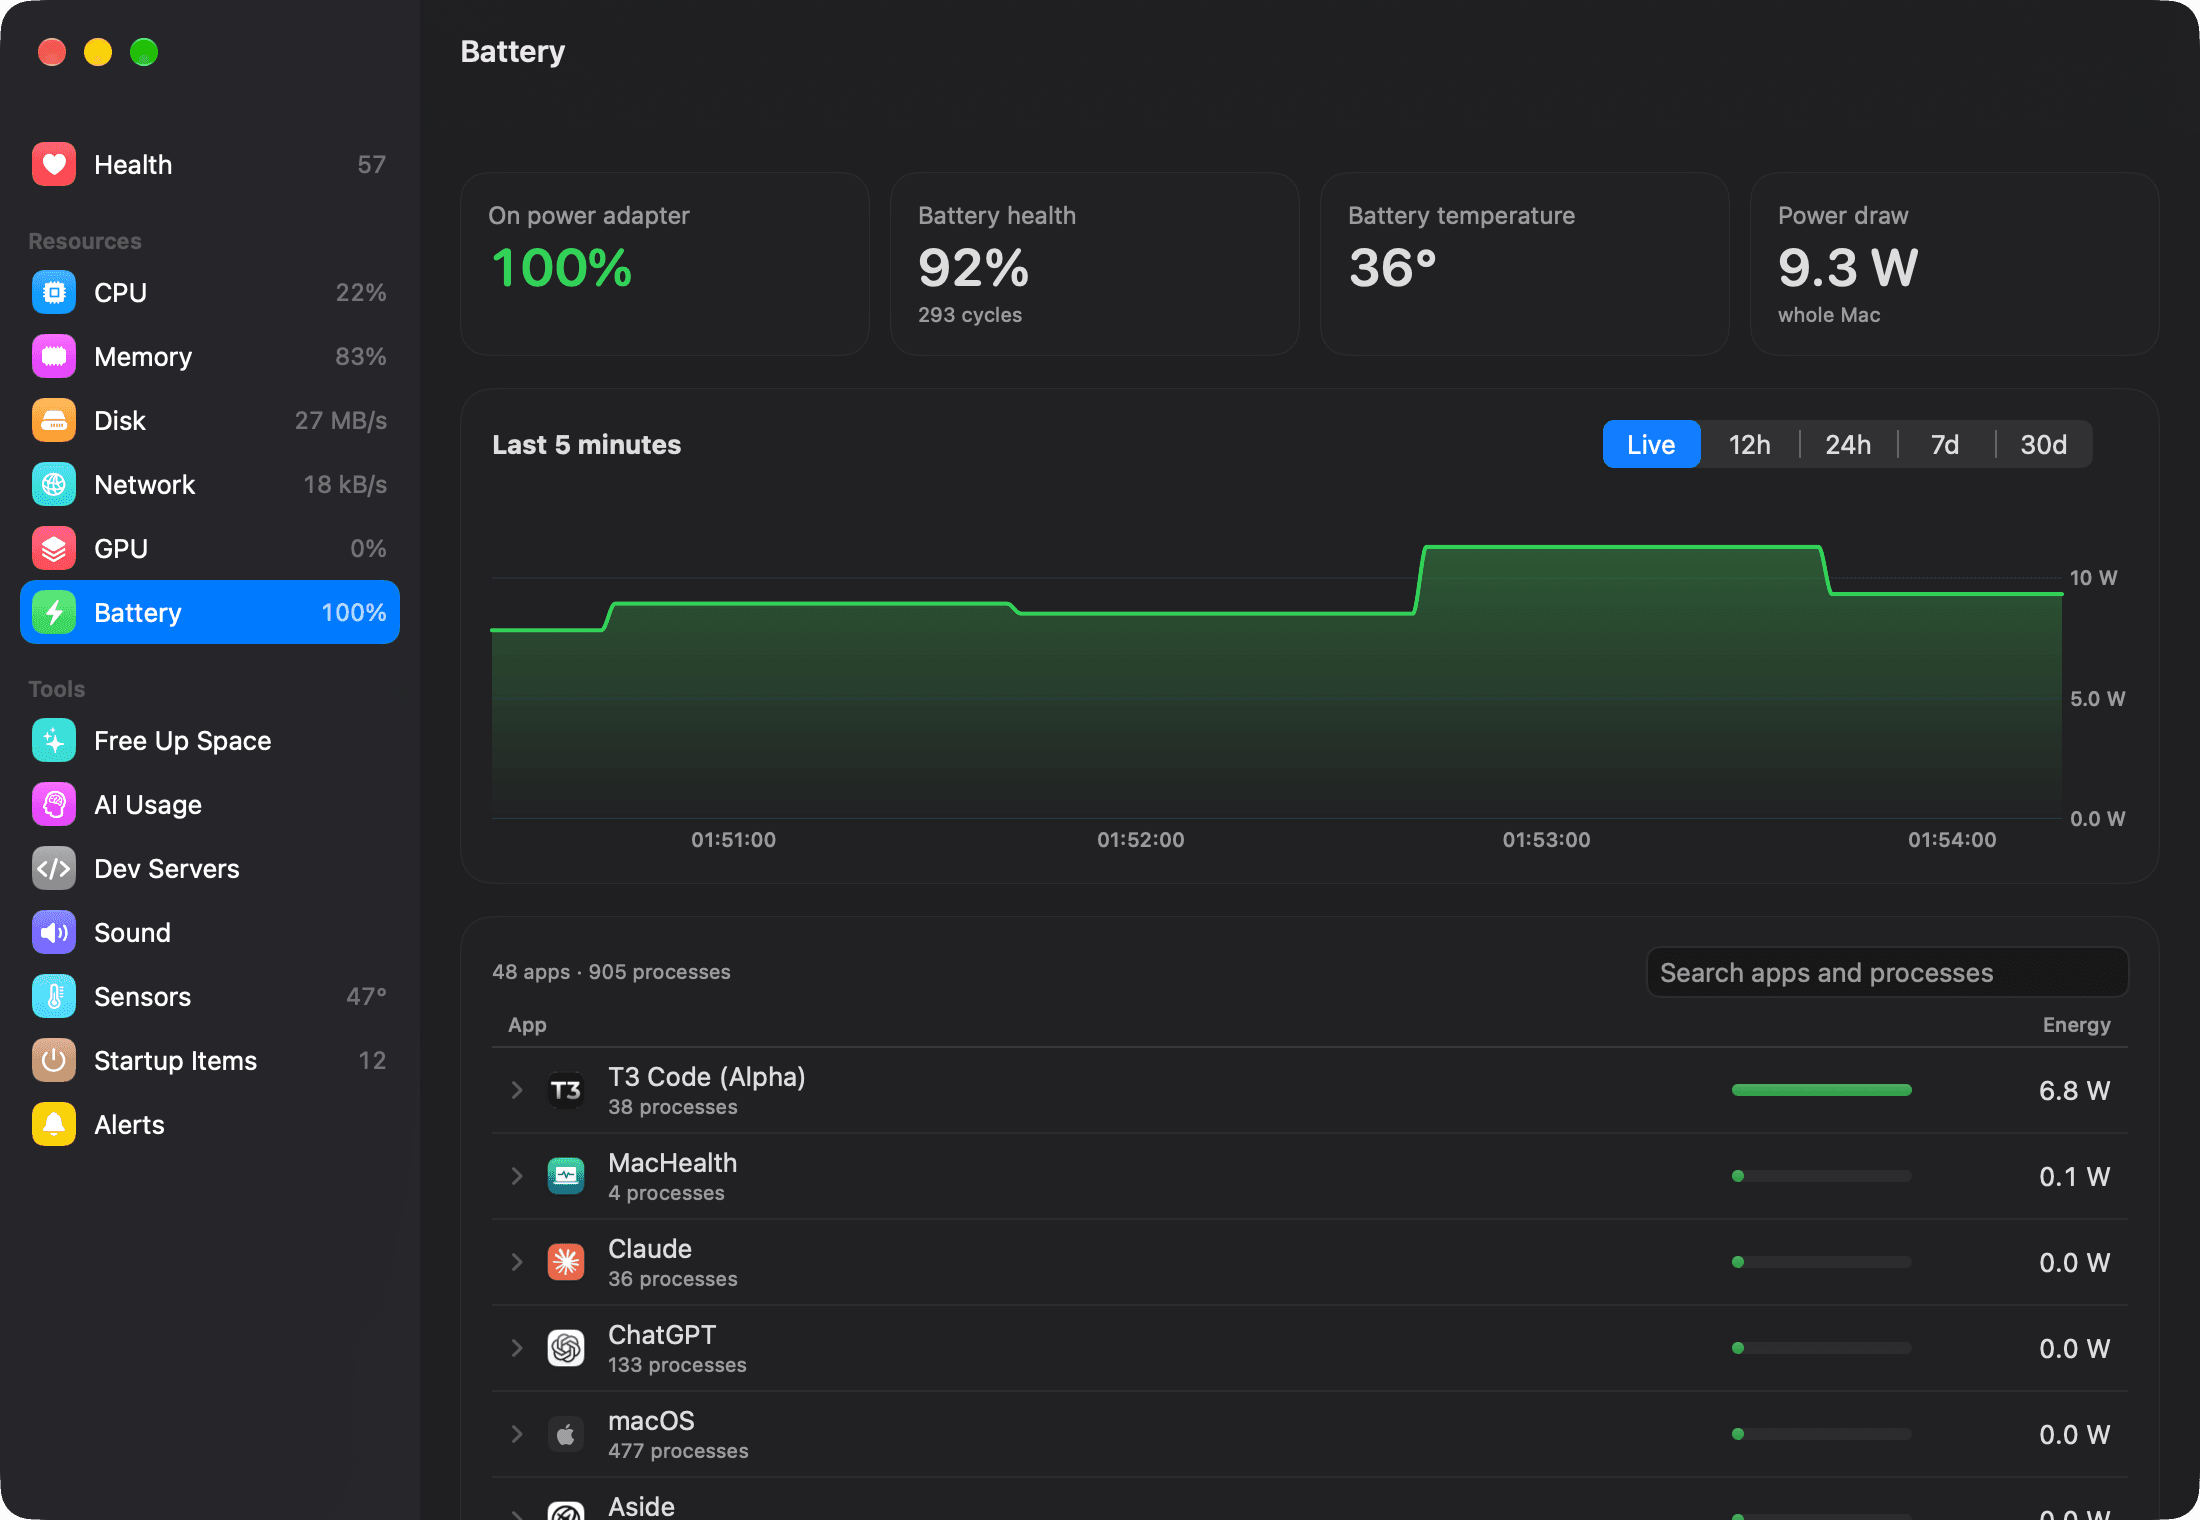
Battery and energy.
Battery health against its original capacity, cycle count, temperature, and how many watts the whole Mac is drawing, with the energy each app uses.
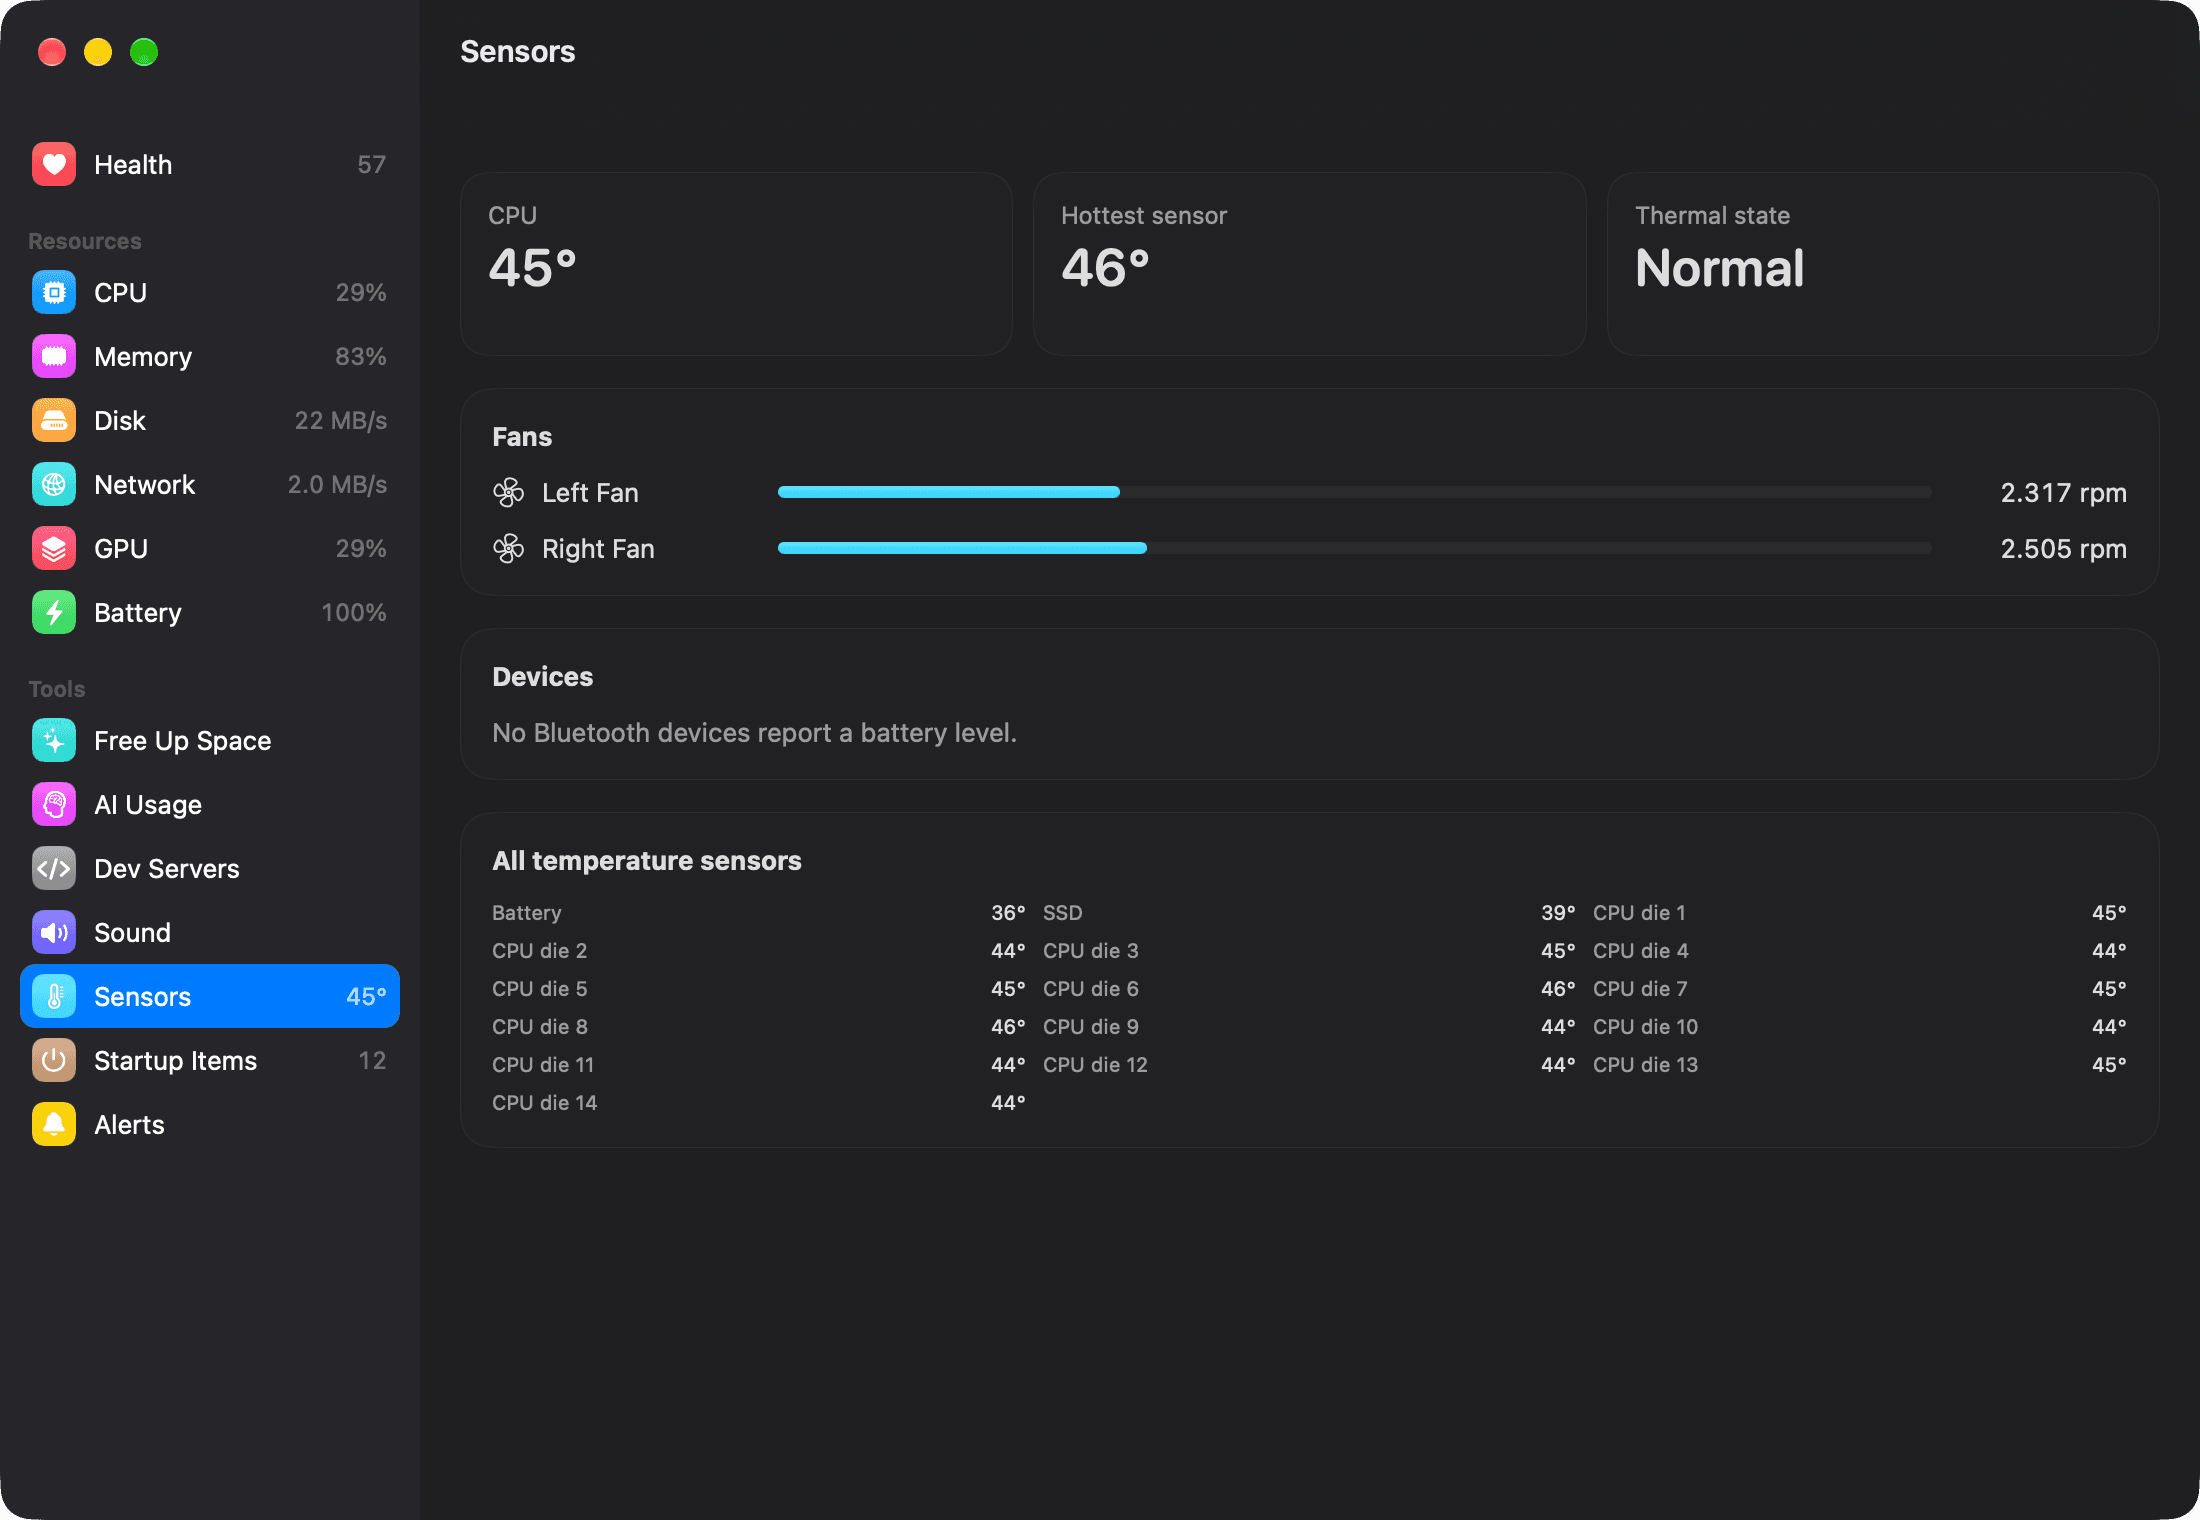
Temperatures and fans.
CPU temperature, every sensor on the chip, fan speeds, and the battery level of your AirPods, mouse and keyboard.
- Alerts when an app misbehaves
- A notification when an app pins a CPU core, keeps growing in memory, or hammers the disk or network.
- A weekly report
- Every Monday morning: your average score, the heaviest apps of the week and the space you cleaned up.
- Widgets
- Your score and live figures on the desktop or in Notification Center, in small, medium and large.
- 30 days of history
- One point a minute for every metric and every app, in one small file on your Mac.
- Volume per app
- Turn the meeting up and the music down, up to 150%. Nothing is recorded.
- Exact figures for system processes
- An optional read-only helper measures macOS's own processes too. You approve it once in System Settings.
Your agent can check it too.
Ask Claude Code why your Mac is slow. MacHealth answers with the score, the causes and the fixes, and can quit an app or stop a dev server once you say yes.
claude mcp add machealth -- /Applications/MacHealth.app/Contents/Helpers/machealth mcpOr use it from Terminal: machealth status, machealth top memory, machealth storage, machealth ai. Every command also speaks JSON.
Almost invisible.
0.4%of the CPU
23 MBof memory
Measured from the menu bar on an M4 Pro running 800 processes. It checks every 10 seconds when you are not looking, and every 2 seconds when you are.
Nothing
leaves
your Mac.
No account, no analytics. One request a day checks for updates, and you can turn it off. What you run stays between you and your Mac.
Free. For macOS 26 and later, Apple silicon and Intel.
Opening it the first time
- Open the download and drag MacHealth to Applications.
- Open MacHealth. macOS says it cannot verify the developer, because this build is not notarized by Apple yet. Click Done.
- Go to System Settings, Privacy & Security, scroll down and click Open Anyway. You only do this once.